
In the world of finance, one of the main goals an investor has to achieve is maximizing his return while minimizing his risk. It is a delicate balance to achieve, but one that is necessary since the risk-adjusted performance of your investments is what matters the most.
The Sharpe Ratio, one of the most popular metrics used to evaluate investment strategies was developed by Nobel laureate William F. Sharpe (1990 Nobel Memorial Prize in Economic Sciences). Sharpe is an Emeritus Professor of Finance at Stanford University’s Graduate School of Business.
What is the Sharpe Ratio
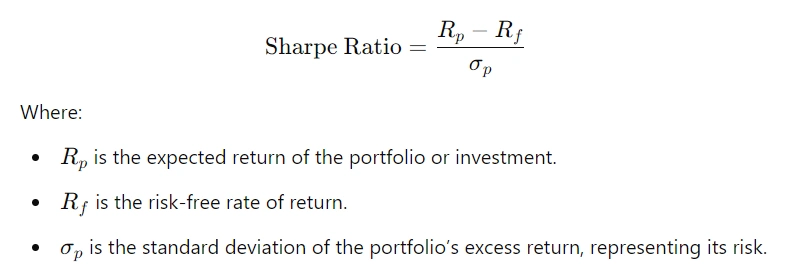
The Sharpe Ratio is a measure that helps investors understand the return of an investment compared to its risk. It is defined as the difference between the return of your investment and the risk-free rate, divided by the standard deviation of your investment’s excess return. The formula is as follows:
Interpreting the Sharpe Ratio
The Sharpe Ratio is used by investors to determine if returns of an investment are a result of smart investment decisions or due to taking on excessive risk. A high Sharpe Ratio means the investment is giving more returns for less risk. Conversely, a lower Sharpe Ratio indicates that the returns are perhaps not high enough to justify taking on such a risk:
- Sharpe Ratio > 1: a ratio over 1 is conisdered good. It indicates that the investment is generating more return for each unit of risk.
- Sharpe Ratio < 1: a value below 1 indicates that the return is not high enough to take such a risk. It could be a sign that the investor is taking too much risk based on potential returns.
- Sharpe Ratio = 1: a value of 1 shows that the return and risk are in perfect balance. It means that the investment is offering a proper risk reward ratio.
Although a higher Sharpe Ratio is normally more desirable, investors should measure this ratio against others of the same investments or portfolios to make an appropriate assessment. For example, comparing the Sharpe Ratio of a high risk stock portfolio against that of low risk bond investment may result in misinterpretation as they have different risk profiles.
Example How To Calculate The Sharpe Ratio
To give an example, assume we have the following trading performance and its Sharpe Ratio Calculation. Say that an investor is looking at a portfolio with expected return of 10% per year and standard deviation of 15%. Ten-year U.S. Treasury bonds sell for about 2%, the current risk-free rate.
From the Sharpe Ratio formula: Sharpe Ratio = (10%−2%)/15 % = 8%/15% = 0.53.
With a Sharpe Ratio of 0.53 in this example, there is what appears to be a relatively low return for the risk taken on with the portfolio. Comparing this ratio to other similar portfolios may cause the investor to seek alternative investment options with a more favorable risk-adjusted return.
Uses of the Sharpe Ratio in Finance
The Sharpe Ratio is an incredibly useful tool across a number of financial fields including:
Portfolio Management
The Sharpe Ratio is a common measure that portfolio managers use while building and rebalancing their portfolios. It helps them see the value that a new investment or asset provides to their portfolio in terms of risk-adjused returns. Comparing the Sharpe Ratios of various portfolios or funds, and fund managers are easily able to determine those that yield fair returns relative their risk profile.
Performance Evaluation
The Sharpe Ratio is frequently employed in assessing the performance of mutual funds, hedge funds et other investments like gold IRA accounts. The Sharpe Ratio measures the risk adjusted return, this is how investors can compare two different funds returns by comparing their Sharpe Ratios and see which one has a better return per unit of risk. It is particularly useful if the comparison is being made between two funds in the same asset class.
Risk Management
Risk management is a key aspect of investing, and the Sharpe Ratio offers a quantitative approach to managing and mitigating risk. By focusing on risk-adjusted returns, investors can avoid taking on unnecessary risks and ensure that their portfolios are aligned with their risk tolerance and investment goals.
Asset Allocation
The Sharpe Ratio in used for asset allocation, it is the metric investors use to determine how much of their capital they ought to allocate into different types of assets. By using varying weights for each asset class and investment within their portfolio, they can see how changing the components of said portfolio will affect the overall Sharpe Ratio.
Disadvantages of the Sharpe Ratio
However, there are some shortcomings associated with the Sharpe Ratio.
It assumes returns follow a normal distribution ( one of its key criticisms), because in reality this is not exactly true, even though the normal distribution is a close approximation to said financial returns. Asset returns are indeed skewed and have a platykurtic or leptokurtic distribution, which in general means the risks are underested.
Moreover, the Sharpe Ratio does not distinguish between upside and downside volatility, which is not symetrical. As the impact of a negative return on investors is considered more serious, risk adjusted performance measures that focus on downside deviation such as Sortino Ratio often provide a better risk assessment.
The Sharpe Ratio is a popular risk-adjusted return measure in finance. It gives an easy yet powerful way to compare investments, allowing investors and portfolio managers alike to make capital allocation decisions with good precision.
The Sharpe Ratio should be considered complementary and used alongside other measures and qualitative analysis to form a complete picture of risk & return characteristics of investment opportunities. Like all other tools and tactics in the field of finance, understanding its advantages & disadvantages can play an important role in getting better investment outcomes for you.
If you are interested in investing in gold to improve your Sharpe ratio, check my pages Gold IRA FAQ Guide for Affluent Investors or the review of the best Gold IRA provider.